After-hours / Eng

After-hours: Monday 17 august

Daily chart. Moving averages on the price chart: EMA (20) in red, EMA (50) in purple, EMA (200) in gold

Macroeconomic calendar of key events for the day

Markets, August 17: Stocks Fall as Oil and Yields Climb, Investors Await Retailer Earnings
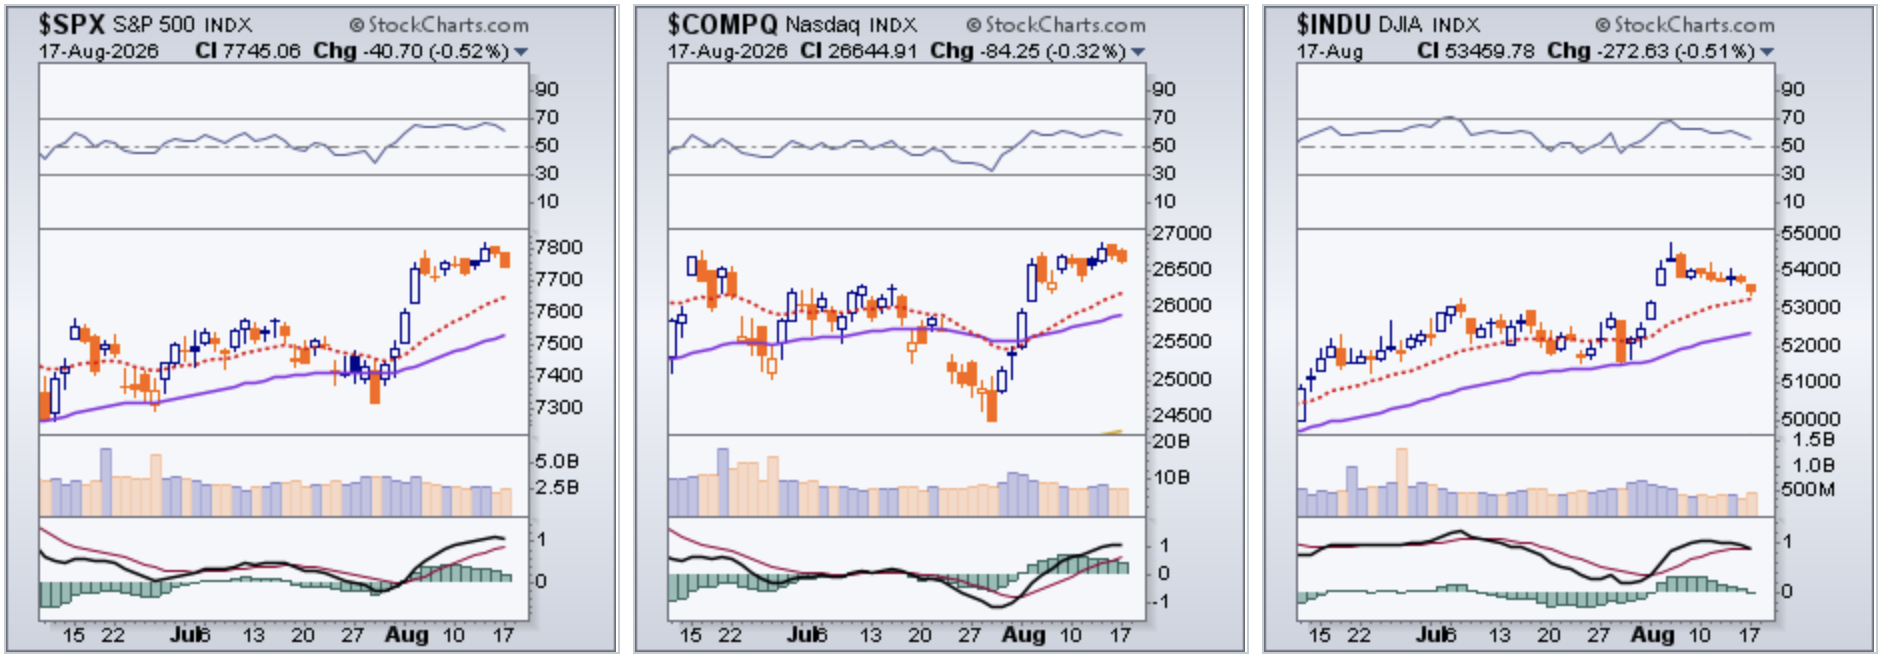
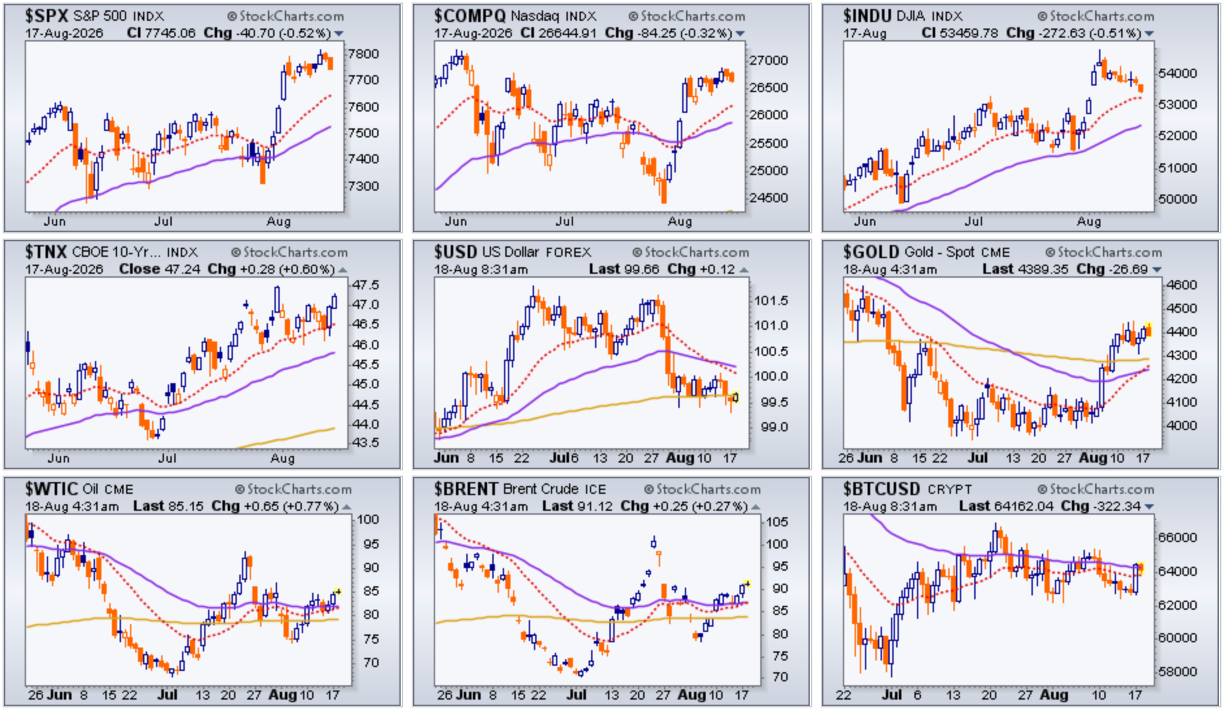
Stocks closed lower across the board on Monday: the Dow fell 0.51%, the S&P 500 lost 0.52%, and the Nasdaq Composite dropped 0.32%.

Daily chart. At the top of each chart — the Relative Strength Index RSI (14); on the price chart — moving averages: EMA (20) in red, EMA (50) in purple, EMA (200) in gold; at the bottom — the Percentage Price Oscillator PPO (12, 26, 9)
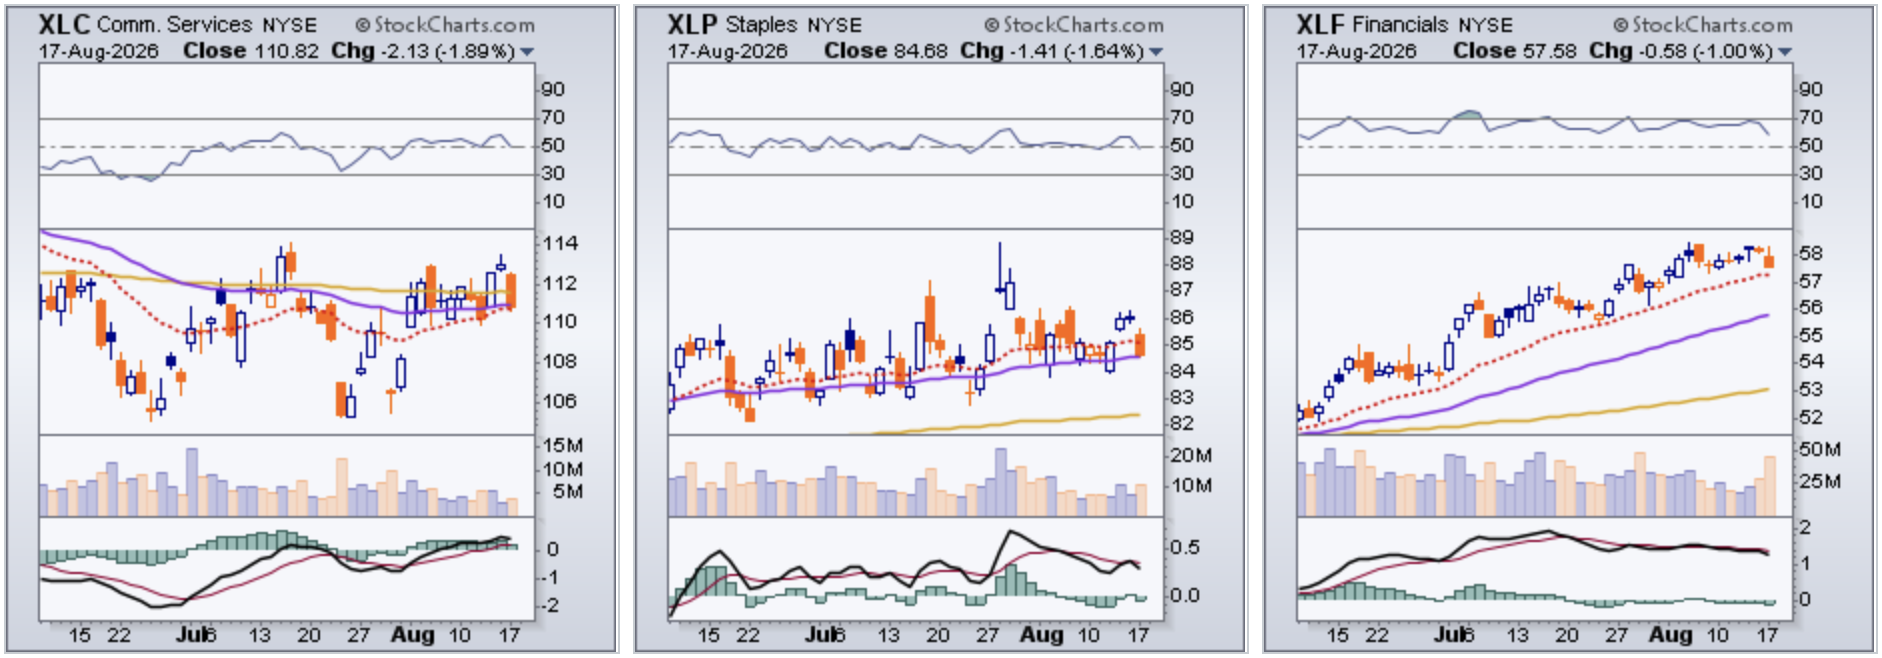
Ten of the S&P 500's 11 sectors declined, with communication services, consumer staples, and financials leading the losses.

Daily chart. At the top of each chart — the Relative Strength Index RSI (14); on the price chart — moving averages: EMA (20) in red, EMA (50) in purple, EMA (200) in gold; at the bottom — the Percentage Price Oscillator PPO (12, 26, 9)
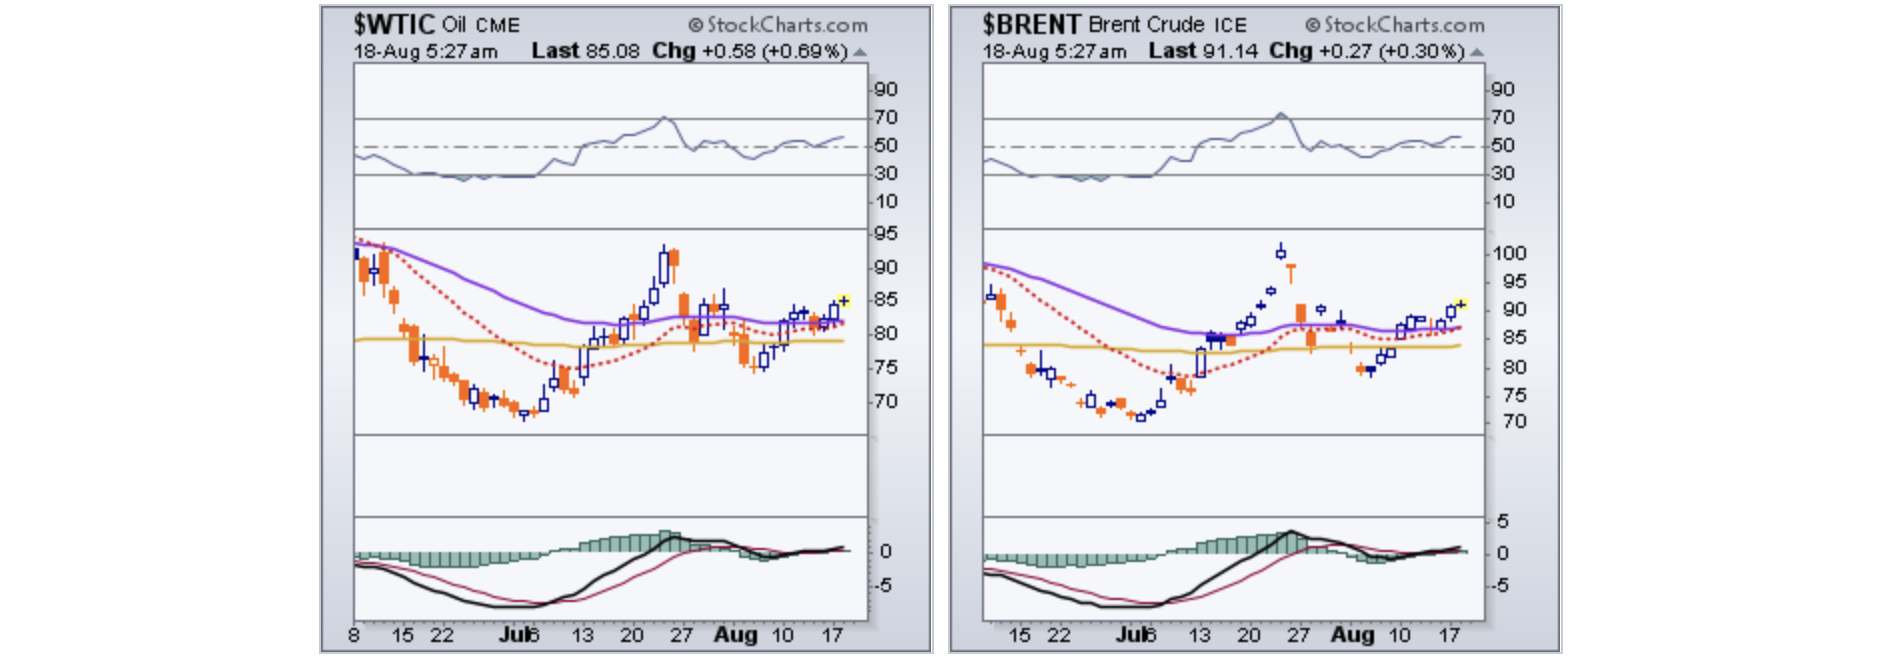
The trigger was a jump in oil prices amid fading hopes for a near-term US-Iran deal on the Strait of Hormuz — efforts to restore shipping through the region remain stalled, and a senior Iranian official told Reuters the country "will be ready to make decisions and take action" should diplomatic efforts with the US fail. WTI rose 2.4% to $84.35 a barrel, while Brent gained 2.4% to $90.65.

Daily chart

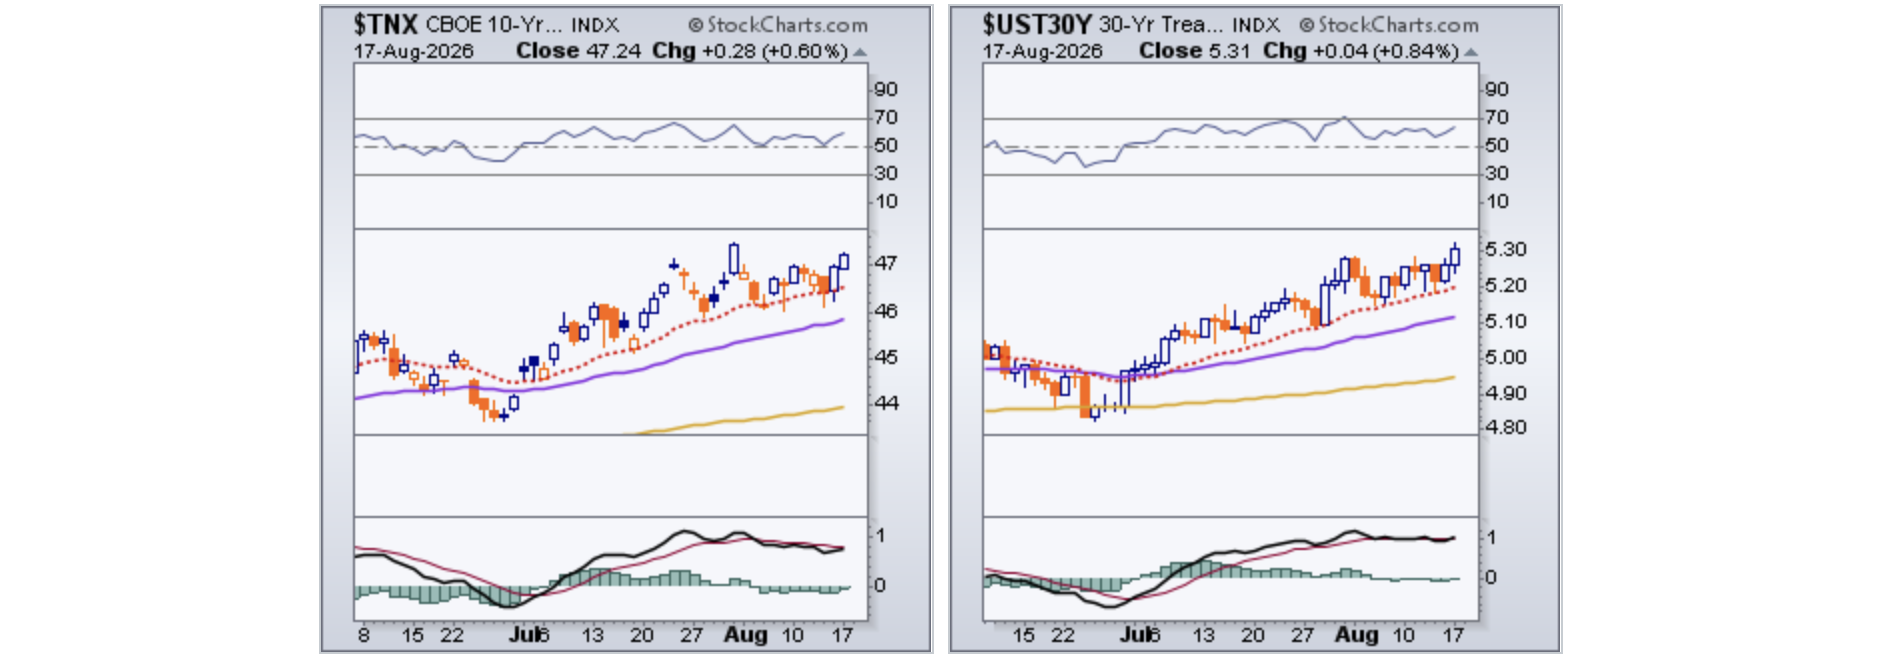
Yields climbed alongside oil: the 10-year Treasury yield rose to around 4.73% (up three basis points from Friday's close), while the 30-year yield jumped to 5.31% — its highest level since 2007, reflecting concerns over inflation and rising government spending.

Daily chart

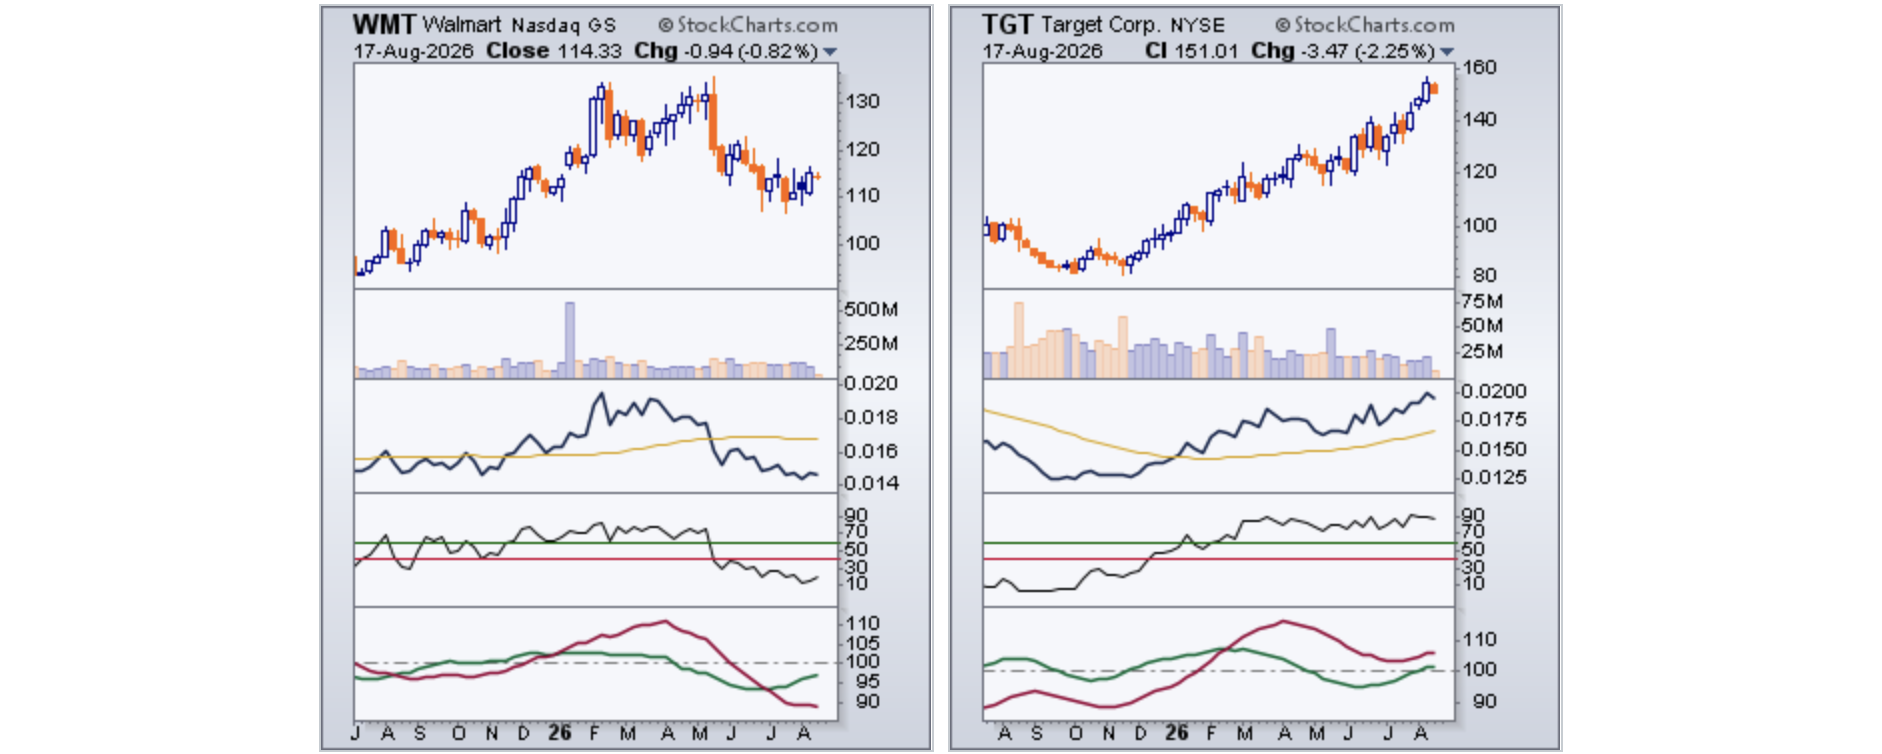
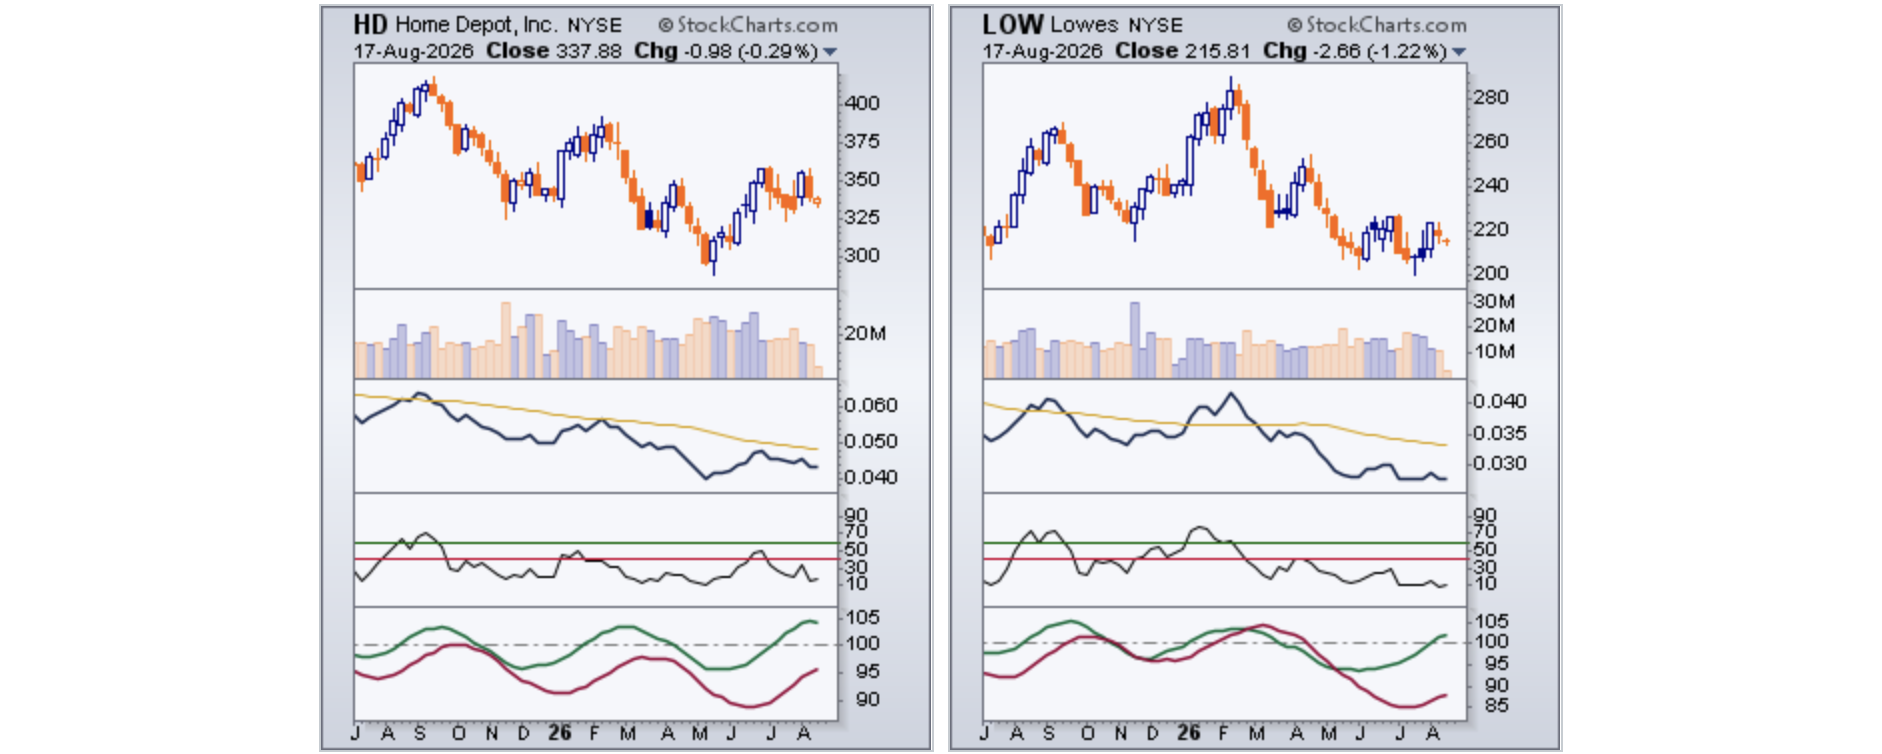
Stocks also closed last week lower, partly because July retail sales fell 0.6% in the US against an expected 0.1% increase. This week, investors will get a fuller picture of consumer spending as major retailers — Walmart [WMT], Target [TGT], Home Depot [HD], and Lowe's [LOW] — report quarterly results. Chris Larkin, managing director of trading and investing at E*TRADE from Morgan Stanley, noted that these reports could show whether last week's soft consumer data was a one-off or something more significant.

Weekly chart. Third box — the stock's relative strength vs S&P 500 [SPX]; fourth — SCTR technical rating; bottom box — RS-Ratio and RS-Momentum components for the Relative Rotation Graph (RRG) vs S&P 500 [SPX]
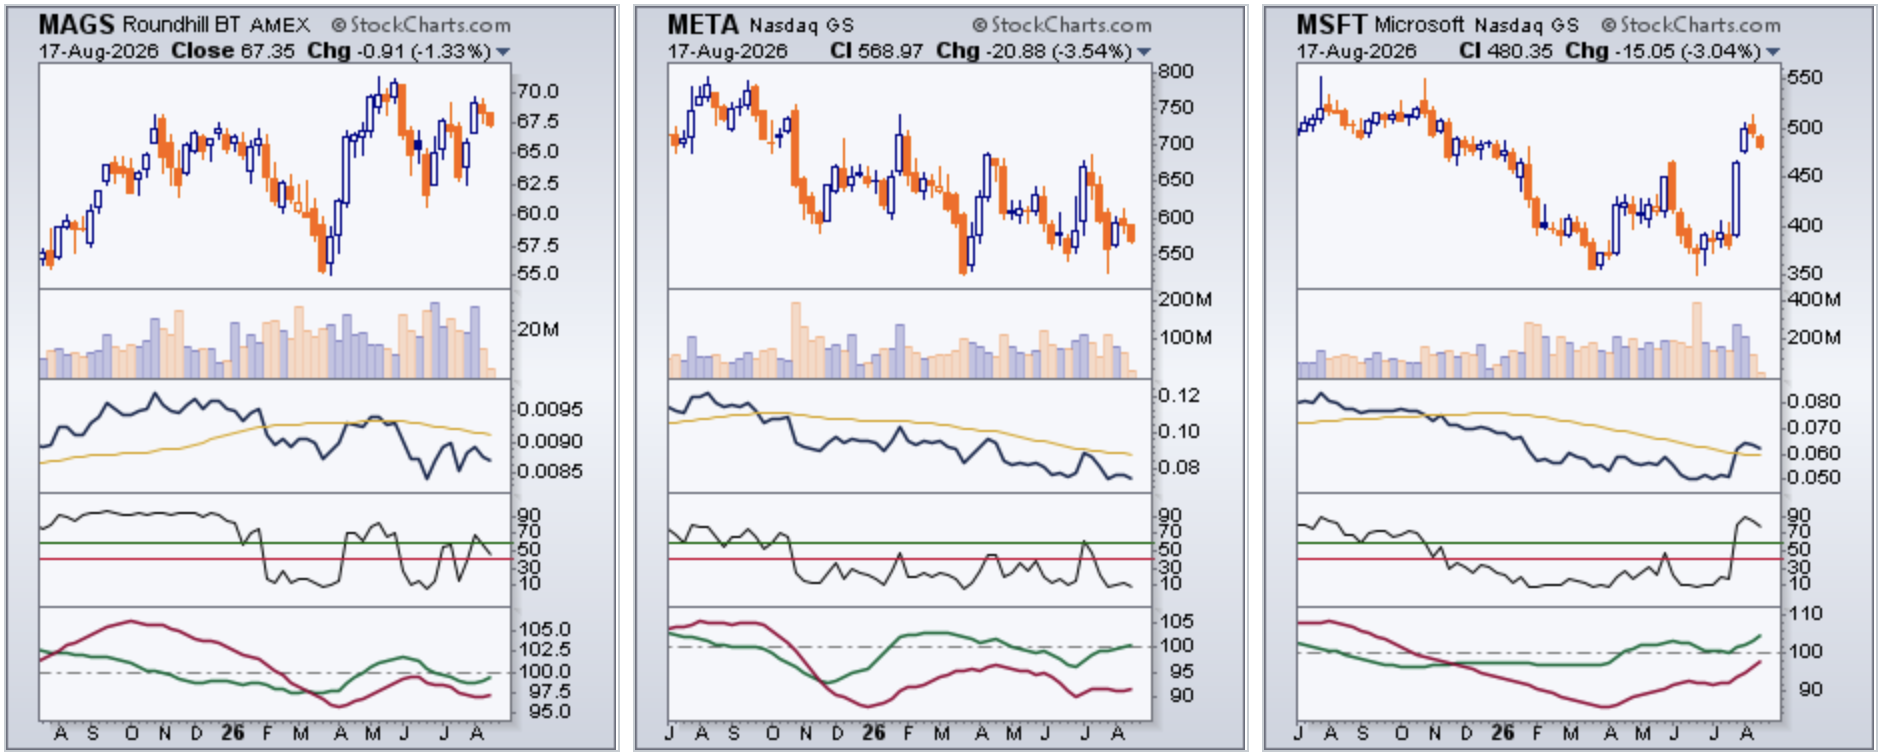
All members of the "Magnificent Seven" closed lower; Meta Platforms (−3.5%) and Microsoft (−3%) led the group's decline.

Weekly chart. Third box — the stock's relative strength vs S&P 500 [SPX]; fourth — SCTR technical rating; bottom box — RS-Ratio and RS-Momentum components for the Relative Rotation Graph (RRG) vs S&P 500 [SPX]
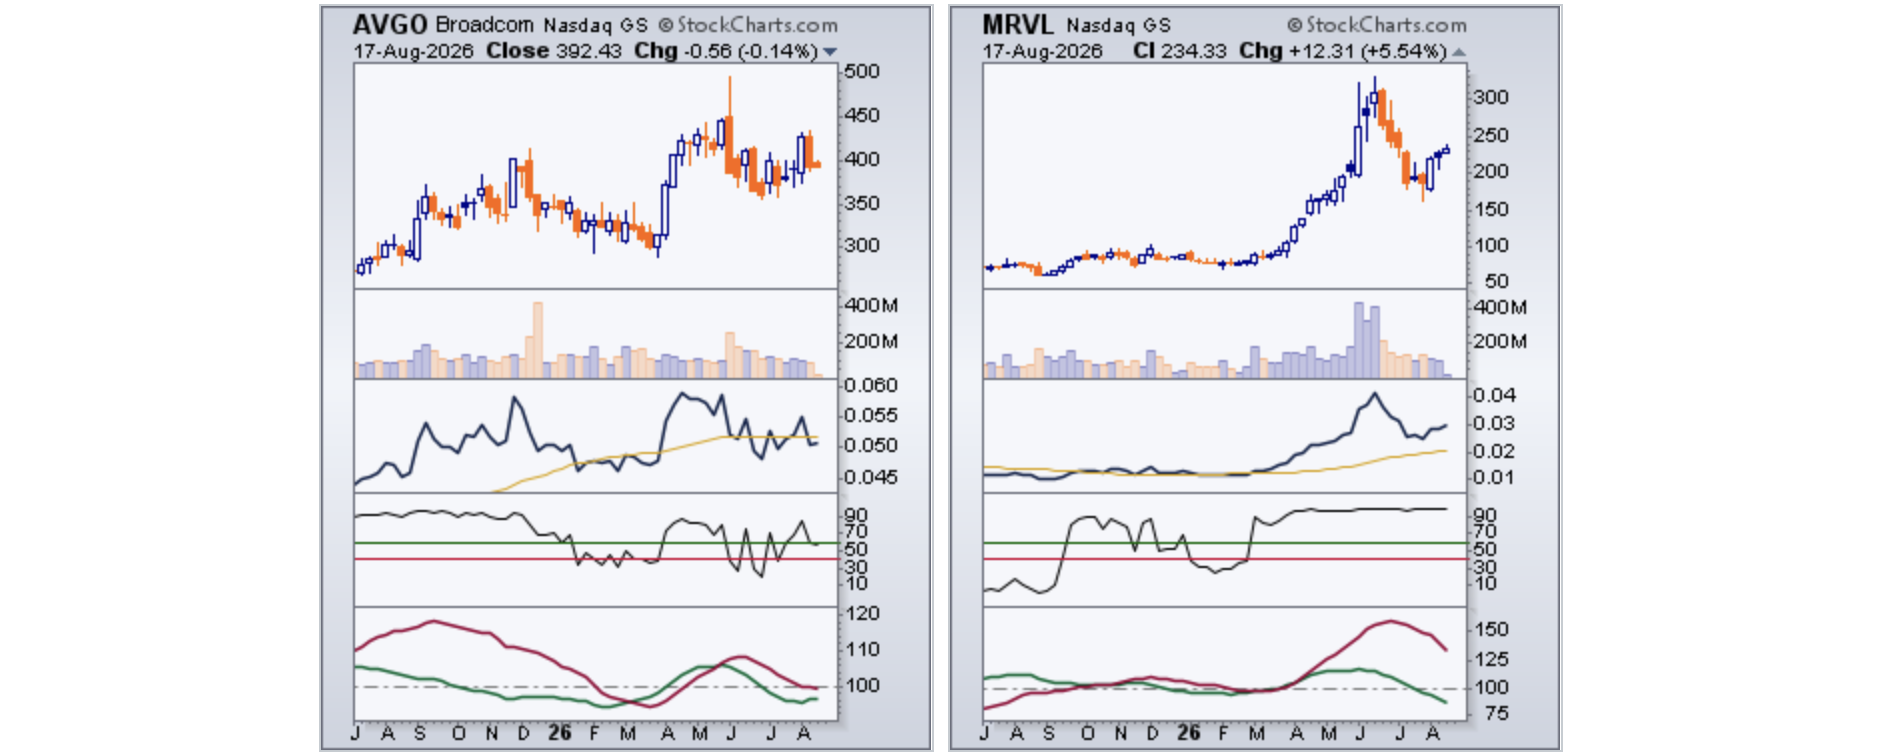
Broadcom [AVGO] slipped 0.1%, following Friday's nearly 6% drop, when the company — the world's sixth most valuable public company at roughly $1.9 trillion — led losses across the Nasdaq 100 and S&P 500. Broadcom has long outgrown its label as "just another chipmaker": together with Marvell, it has effectively cornered the market for designing custom AI chips (ASICs) for hyperscalers, a role now filled for Google (TPU), Meta (MTIA), and also OpenAI and Anthropic. Its order backlog for these chips tops $70 billion, and management is targeting $100 billion in annual AI chip revenue by 2027.

Weekly chart

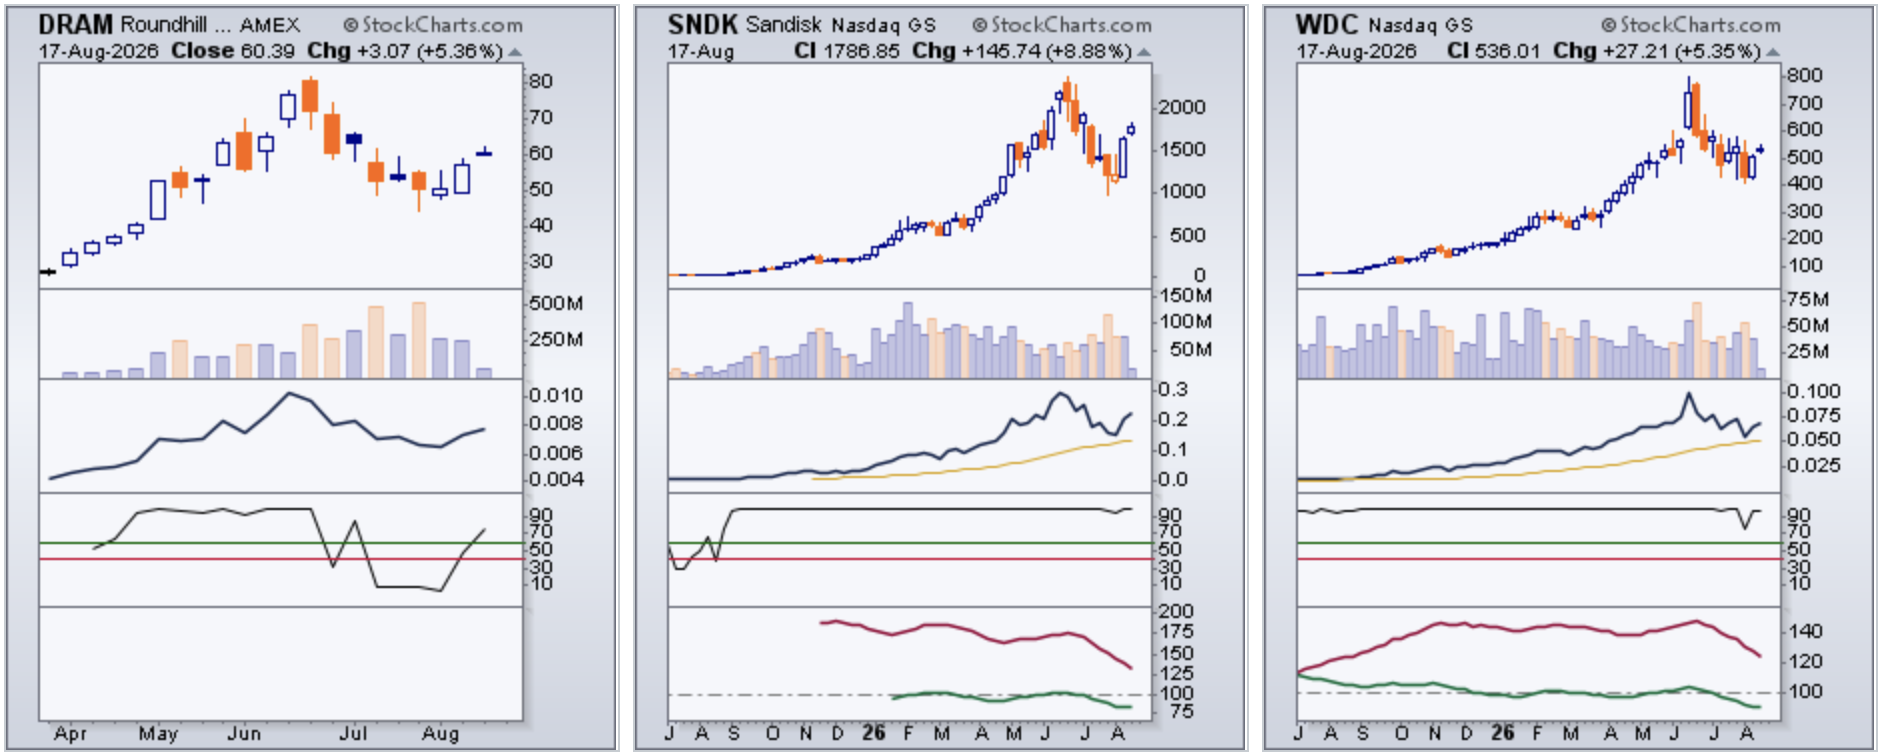
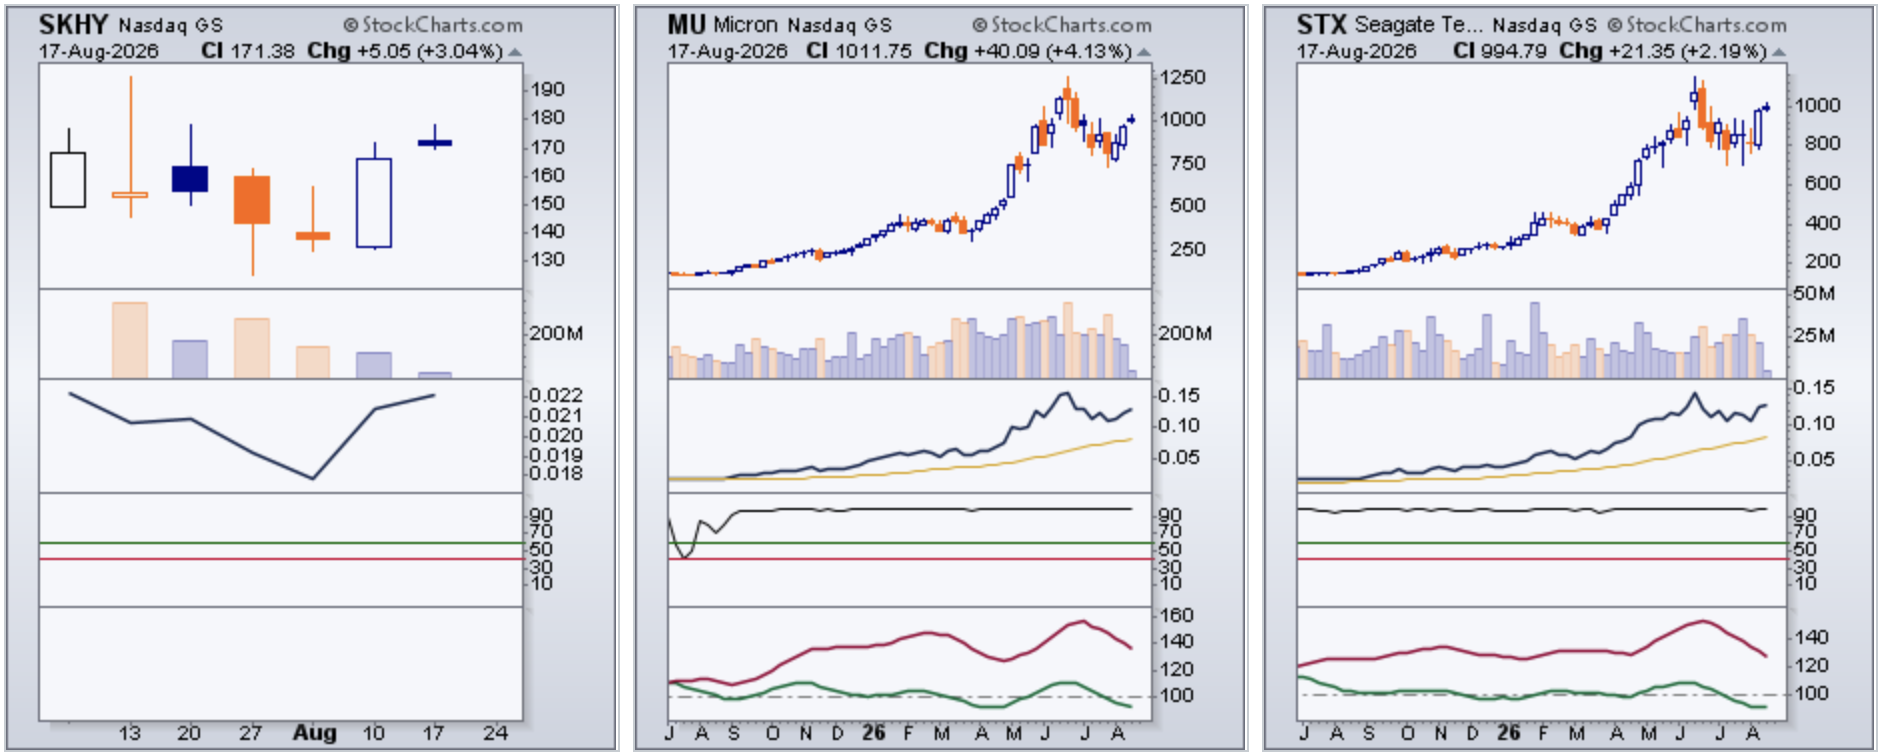
Memory makers stood out against the broader decline: the Roundhill Memory ETF (DRAM) rose more than 5% as component stocks Sandisk [SNDK], Western Digital [WDC], SK Hynix [SKHY], Micron [MU], and Seagate Technology [STX] gained roughly 2–9%.

Weekly chart

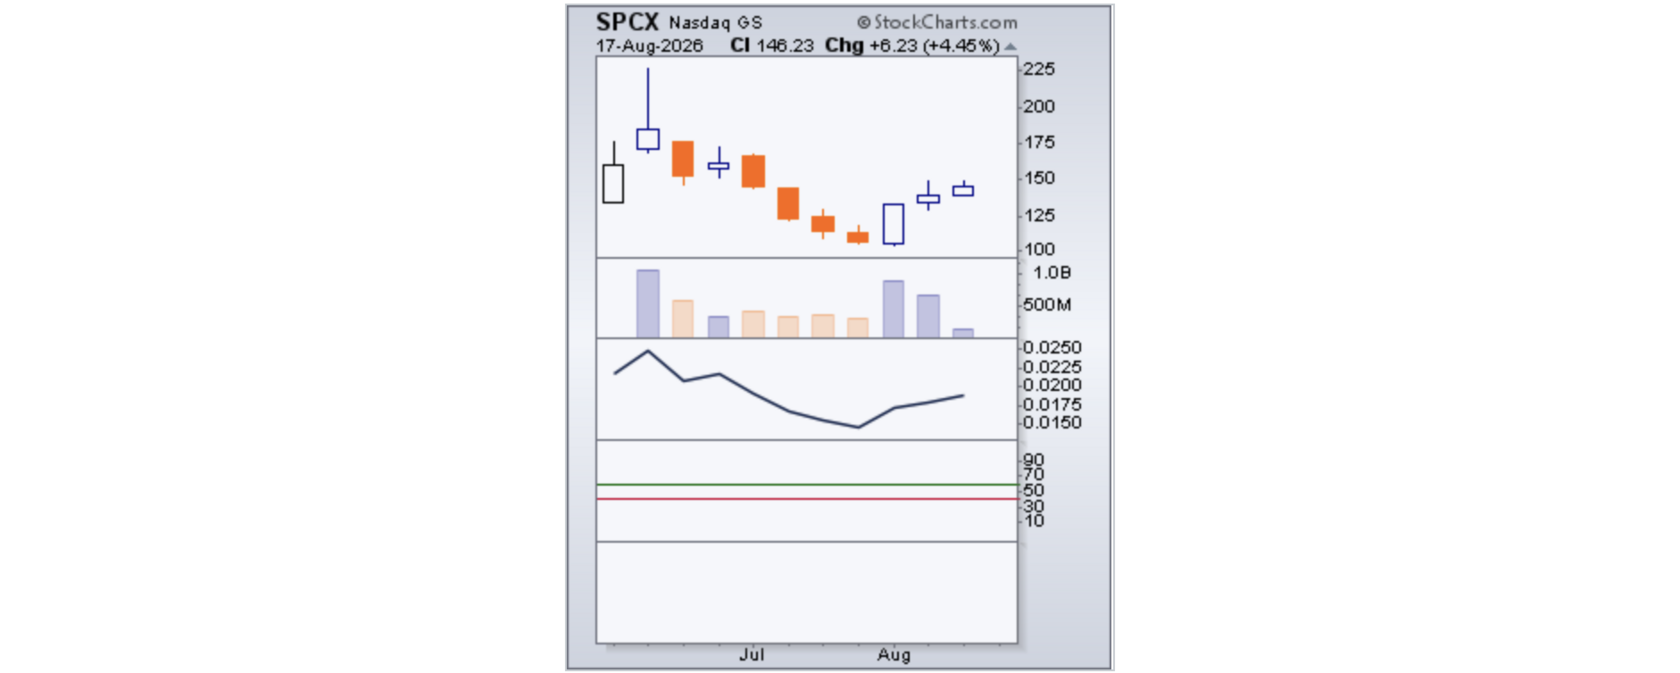
SpaceX [SPCX] bucked the trend, rebounding 4.5% after closing down 1% on Friday; the stock remains below its $150 IPO price set two months ago.

Weekly chart

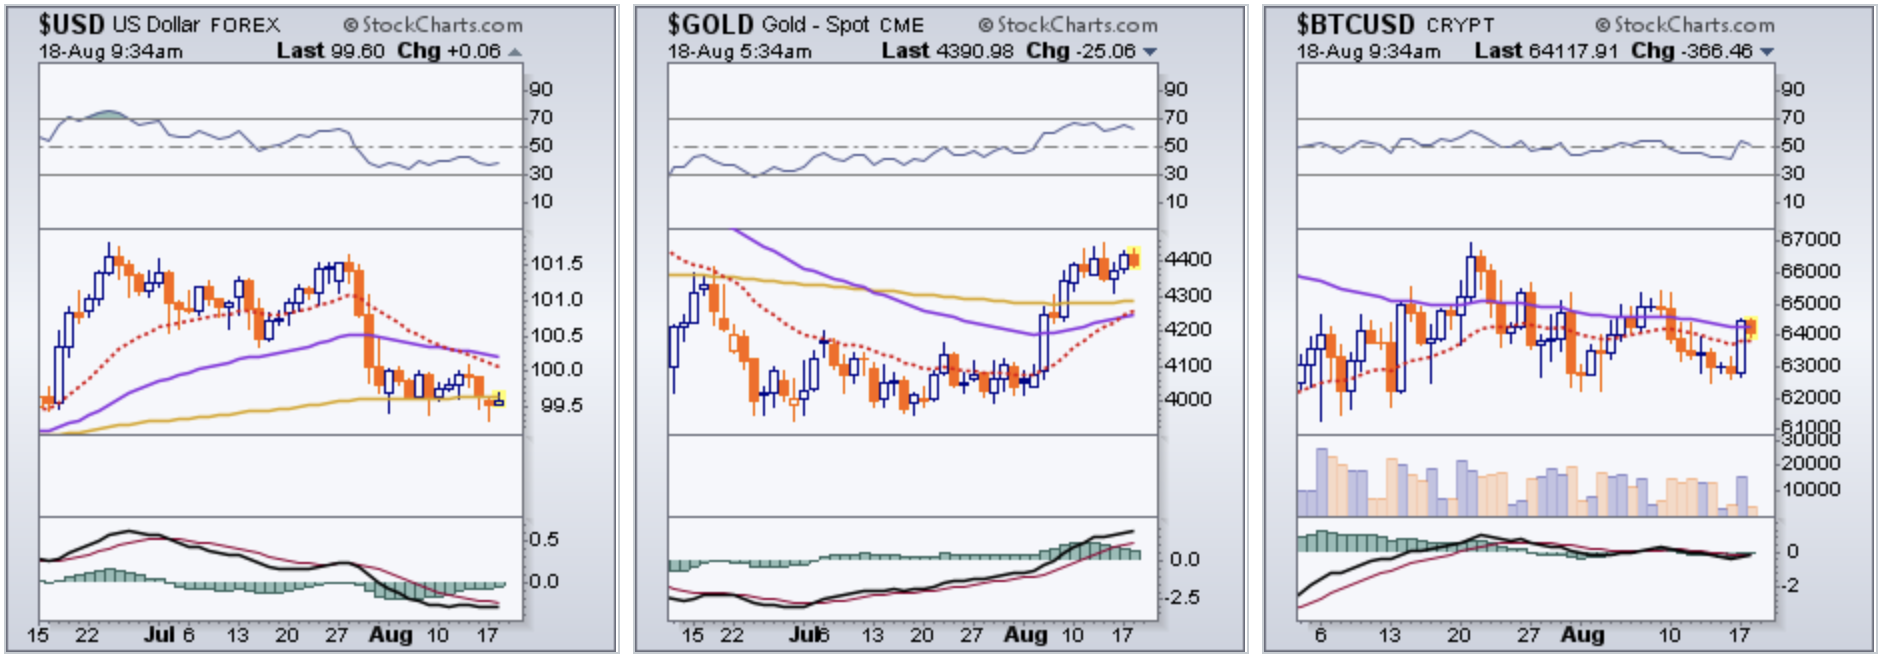
The dollar index fell 0.1% to 99.57 — having touched 99.29 earlier in the session, its lowest level since early June. Gold rose 0.9% to $4,475 an ounce, while bitcoin traded around $64,300, up from overnight lows near $62,700.

Daily chart


Back to homepage: weknow.market
Sources: TradingEconomics, Investopedia, StockCharts
Author: Igor Gurevich, laurels.team